Creator Analytics Platforms for Community Engagement, Cross-Platform Reach, and Audience Quality
Follower count is useful for describing the nominal size of a creator’s audience, but it says little about how much attention that audience actually gives to the content. For partnership decisions, deeper signals such as saves, shares, repeat viewing, watch time, link clicks, audience authenticity, and downstream conversions are more informative.
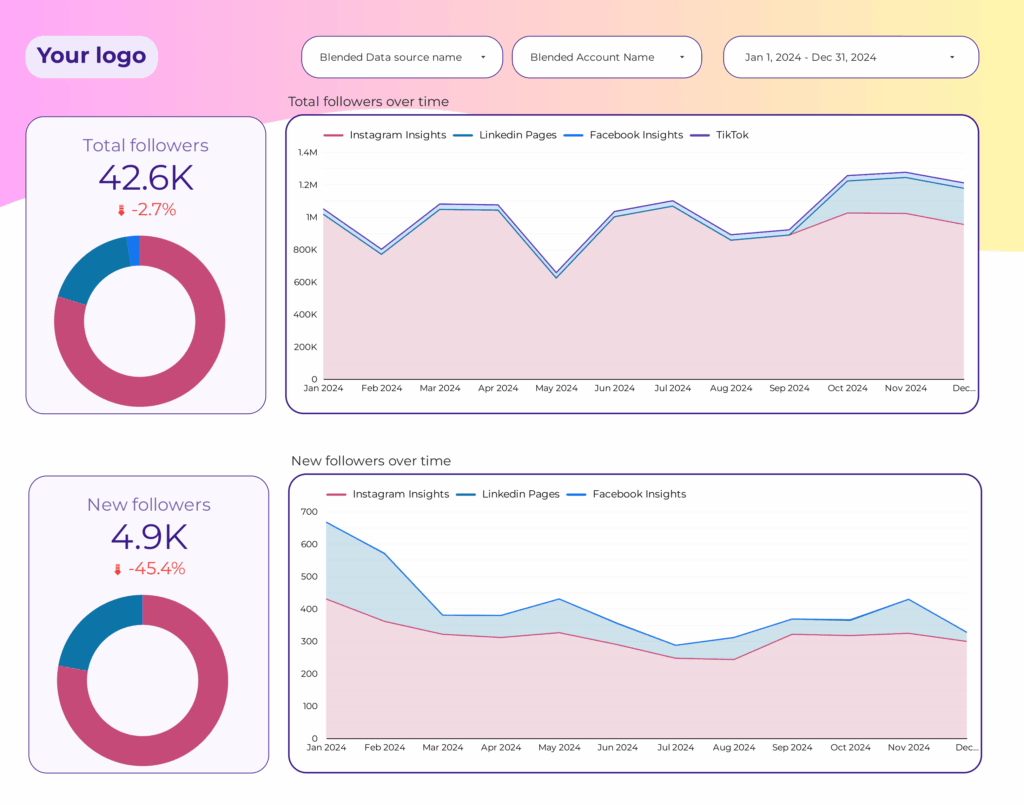
The difficulty is that Instagram, YouTube, TikTok, and third-party analytics platforms do not expose identical data. A metric called engagement on one service can include a different combination of actions from the same term on another. Reach is usually deduplicated within a particular platform or post, but the same person following a creator on Instagram and YouTube cannot simply be counted once when the two numbers are added together.
A useful creator audit therefore begins with native platform analytics, adds cross-platform reporting for comparison, uses audience-quality tools only as supporting evidence, and tracks conversions separately on the destination website or membership system.
Engagement Signals Beyond Likes and Comments
Likes and comments are easy to see, but they represent only part of audience interest. On Instagram, professional-account insights include measures such as accounts reached and accounts engaged. Meta’s Instagram interfaces and APIs also expose interactions that can include likes, comments, saves, and shares. Meta describes accounts engaged as unique accounts that interacted with the content, while its Instagram API includes interaction metrics such as saves and shares.
Saves deserve separate attention because they indicate that someone considered the content worth returning to. Shares can be more meaningful for recommendation-oriented creators because the viewer actively sends the post to another person or redistributes it. Video platforms provide another category of evidence: continued attention.
YouTube Studio shows impressions, impression click-through rate, views, and unique viewers under Reach. Its Engagement reports include watch time and average view duration, while Audience reports distinguish new, casual, and regular viewers. YouTube also provides audience-retention reports showing how viewers remain with a video over time. These metrics can reveal a creator whose audience is smaller but repeatedly returns and watches substantial portions of each upload.
TikTok Studio likewise provides account and video analytics as well as viewer and follower information. Its value is strongest when the creator gives direct analytics access or exports verified campaign results rather than relying on screenshots of public like counts.
A creator-analysis platform should therefore be checked for the following layers:
| Signal | What It Helps Measure |
|---|---|
| Likes | Low-effort positive response |
| Comments | Active discussion |
| Saves | Reference value and later intent |
| Shares | Recommendation or distribution behavior |
| Watch time | Total attention generated |
| Retention | Ability to hold attention |
| Returning viewers | Repeat audience relationship |
| Link clicks | Movement away from the content toward another action |
The strongest metric depends on the campaign. A tutorial creator may be more valuable when saves and repeat viewing are high, while a product-review creator may be judged more heavily on link clicks and qualified inquiries.

Cross-Platform Reach and Duplicate Audiences
Publishing the same video on Instagram Reels, TikTok, and YouTube Shorts creates a measurement problem.
Suppose Instagram reports 100,000 accounts reached, TikTok records 130,000 viewers, and YouTube reports 80,000 unique viewers. Adding the three numbers produces 310,000, but it does not establish that 310,000 different people saw the campaign.
The same person may use all three services.
Third-party platforms can place network data in one report, but that does not necessarily mean they can identify the same human across separate social networks.
Sprout Social explains this limitation directly. It does not provide a general Total Reach metric by simply summing individual reach values because third-party tools do not receive sufficiently granular identity data to deduplicate viewers reliably across posts and networks. Sprout notes that a simple sum can therefore inflate the apparent audience.
This produces an important reporting rule:
Platform reach should remain platform-specific unless the measurement provider explicitly documents cross-platform identity resolution.
A cross-network dashboard can still be useful. Sprout’s Post Performance Report, for example, puts performance from multiple supported networks into a unified view and allows filtering by profile, post type, content type, and date range.
The reporting language should simply remain precise.
Instead of:
Unique campaign reach: 310,000
use:
Gross platform reach: 310,000 across Instagram, TikTok, and YouTube; audience overlap not deduplicated.
For a campaign in which cross-platform duplication matters, combine social analytics with first-party website or app identifiers after users leave the platforms. Even then, privacy rules and consent requirements determine what can legitimately be connected.
Audience Authenticity and Inactive Accounts
Follower fraud cannot be established from one unusual statistic. A sudden increase in followers can result from purchased followers, but it can also follow a viral post, media appearance, giveaway, platform recommendation, or successful advertising campaign.
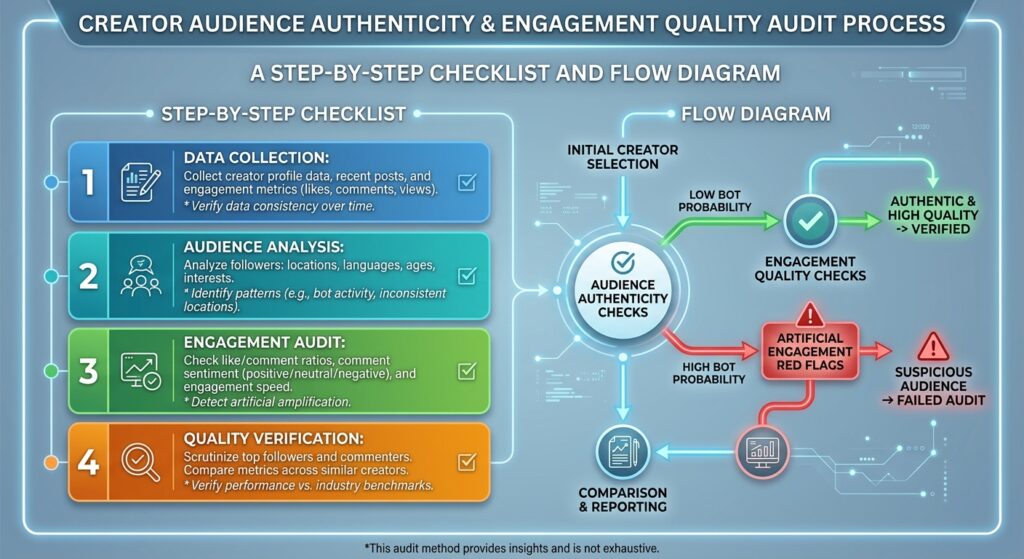
Audience-quality tools are more useful when they examine several signals simultaneously. HypeAuditor states that its fraud-detection system evaluates follower-growth anomalies, engagement patterns, account characteristics, suspicious following behavior, and comment authenticity. It combines these signals in its proprietary Audience Quality Score rather than treating follower count as the main indicator.
Comment patterns can add context. Repeated generic phrases, emoji-only responses, irrelevant comments, and abnormal bursts of similar interaction may justify further investigation. They should not automatically be labeled bots because genuine users can also leave short comments.
Audience geography and language can provide another check. HypeAuditor’s reports include audience country and language information, and its own guidance suggests investigating cases in which the audience’s location or language is difficult to reconcile with the creator’s content and claimed market.
For example, an English-language local restaurant creator claiming an overwhelmingly Korean audience would reasonably be expected to have substantial Korean followers. An unexplained audience dominated by unrelated regions may deserve closer inspection, especially when combined with abnormal growth and low-quality comments.
The useful warning signs are therefore combinations:
- sudden follower growth without a corresponding content event
- large numbers of apparently inactive or mass-following accounts
- repeated or irrelevant comments
- engagement spikes followed by long inactivity
- audience country inconsistent with the claimed market
- audience language inconsistent with the content
- large follower count but very weak repeat viewing or meaningful interaction
A proprietary bot percentage should still be described as an estimate. HypeAuditor’s AQS, for example, is its own scoring methodology rather than an official Instagram, TikTok, or YouTube determination that specific users are bots.
Conversion Signals Beyond Community Response
Strong engagement becomes commercially meaningful only when it leads to the action the campaign was intended to create. For one creator, the next action may be a newsletter subscription. For another, it may be a product inquiry, account registration, app installation, paid membership, or completed purchase.
Social-platform analytics alone cannot always see what happens after a viewer leaves the platform. A practical setup gives each creator or campaign identifiable destination links. Google Analytics recommends campaign parameters such as utm_source, utm_medium, and utm_campaign when manually tagging inbound links so traffic can be associated with its acquisition source.
The destination website can then record the actual outcome. GA4’s recommended events include sign_up for account registrations and generate_lead for actions such as form submissions, newsletter sign-ups, or demo requests. Its lead framework also includes a converted-lead event for cases such as a paid subscription beginning, while the purchase event records completed purchases.
A creator campaign can therefore be read as a funnel:
content exposure → meaningful engagement → link click → landing-page visit → inquiry or registration → paid action
This prevents a creator with large comment volume from automatically outperforming one whose audience quietly converts.
For example, Creator A may produce 4,000 comments and 300 qualified inquiries, while Creator B produces only 1,000 comments but generates 900 inquiries. If lead generation is the campaign objective, Creator B performed better despite having the less visibly active comment section.
Comparable Analysis Periods and Content Formats
Creator comparisons become unreliable when the periods and content types are different.
A creator measured during a product launch should not be compared directly with another creator measured during a quiet month. A 15-second Reel should not be compared with a 25-minute YouTube review using raw views alone.
A better audit fixes the analysis period and content type before ranking creators.
An illustrative comparison could use:
Period: 30 days
Content: organic short-form videos
Paid amplification: excluded
Minimum posts: six per creator
Goal: qualified traffic and newsletter registration
Then compare:
| Measure | Creator A | Creator B |
| Short videos published | 8 | 8 |
| Average platform reach per post | 72,000 | 41,000 |
| Share rate | 1.4% | 2.8% |
| Save rate | 2.1% | 3.9% |
| Repeat-viewing signal | Moderate | High |
| Tracked landing-page visits | 4,200 | 5,100 |
| Newsletter registrations | 310 | 690 |
| Suspected audience-quality issue | Low | Low |
These are illustrative numbers, not platform benchmarks. Their purpose is to show why comparisons should keep time, format, paid status, and campaign objective consistent. YouTube’s analytics tools explicitly support performance comparisons and expanded reports through Advanced Mode, while Sprout’s Post Performance Report permits custom date ranges and content-type filters. The same principle should be applied to long-form videos, live streams, Stories, static posts, and short-form clips separately.
Data Export, Retention, and Account Permissions
Analytics software should also be compared by what happens to the data after the dashboard is closed. YouTube’s Advanced Mode allows creators to expand reports, compare performance, and export analytics data. Channel permissions can also be granted to other people without sharing the underlying Google Account password, allowing creators to control the level of access given to managers or analysts.
Instagram has its own retention limits. Meta’s current documentation says post insights can be viewed for up to two years, and its developer documentation states that Instagram media insights data is stored for up to two years. Third-party platforms create a separate retention layer. Sprout states that subscriber data is retained for the duration of an active subscription. For paid accounts, subscriber data is scheduled for permanent deletion 90 days after account closure or termination; trial-account data is deleted 30 days after the trial ends.
Sprout’s Post Performance Report can also be exported as CSV with the selected filters and date range, which is useful when campaign evidence must be retained independently of a dashboard subscription. Permissions deserve equal attention.
A third-party service should not need the creator’s password directly. Account connections should use the platform’s supported authorization mechanism.
TikTok’s developer model uses permission scopes: an application must be approved for the relevant scope, and the TikTok user must separately authorize access. TikTok states that users can approve or deny requested scopes and revoke authorization later.
Sprout similarly sends users through TikTok authorization when connecting a TikTok Business profile. Its Instagram connection process requires appropriate access to the related business assets before a professional profile can be connected.
Before connecting an analytics service, record:
- which social profiles it can access
- whether access is read-only or includes publishing
- whether messages or comments are accessible
- whether ad accounts are included
- how authorization can be revoked
- available CSV or API exports
- historical backfill limits
- data retention after cancellation

Analytics Platforms by Evaluation Purpose
Native analytics should normally remain the reference point for first-party performance data. YouTube Studio is especially useful for watch time, retention, unique viewers, returning audience behavior, impressions, and video-level discovery. Instagram Insights is useful for Instagram-specific reach and content interactions, including engagement signals that go beyond visible likes.
TikTok Studio is useful for the creator’s own TikTok content, account performance, and audience information.
Cross-network platforms such as Sprout Social become more useful when several connected profiles must be compared over the same dates and content categories. Their limitation is equally important: unified reporting does not automatically create a truly deduplicated cross-platform audience.
Audience-audit platforms such as HypeAuditor serve another role by estimating audience authenticity, demographic fit, follower-growth anomalies, and suspicious engagement. Those estimates should supplement rather than replace native analytics and verified conversion data.
For partnership decisions, the strongest creator is therefore not necessarily the account with the largest following or highest visible engagement rate. A more defensible evaluation combines deep engagement, repeat attention, platform-specific reach, audience quality, tracked downstream actions, and consistent data collected over the same period and content format.
That combination shows whether a community merely reacts to content or actually returns, recommends, clicks, registers, inquires, and eventually converts.